
2 posts tagged with "Observability"

Monitoring, logging, and tracking tool executions

View All Tags

Grafana MCP Server: Monitor, Debug & Explore Your Infrastructure with AI

· 6 min read
MCPBundles

Grafana MCP Server

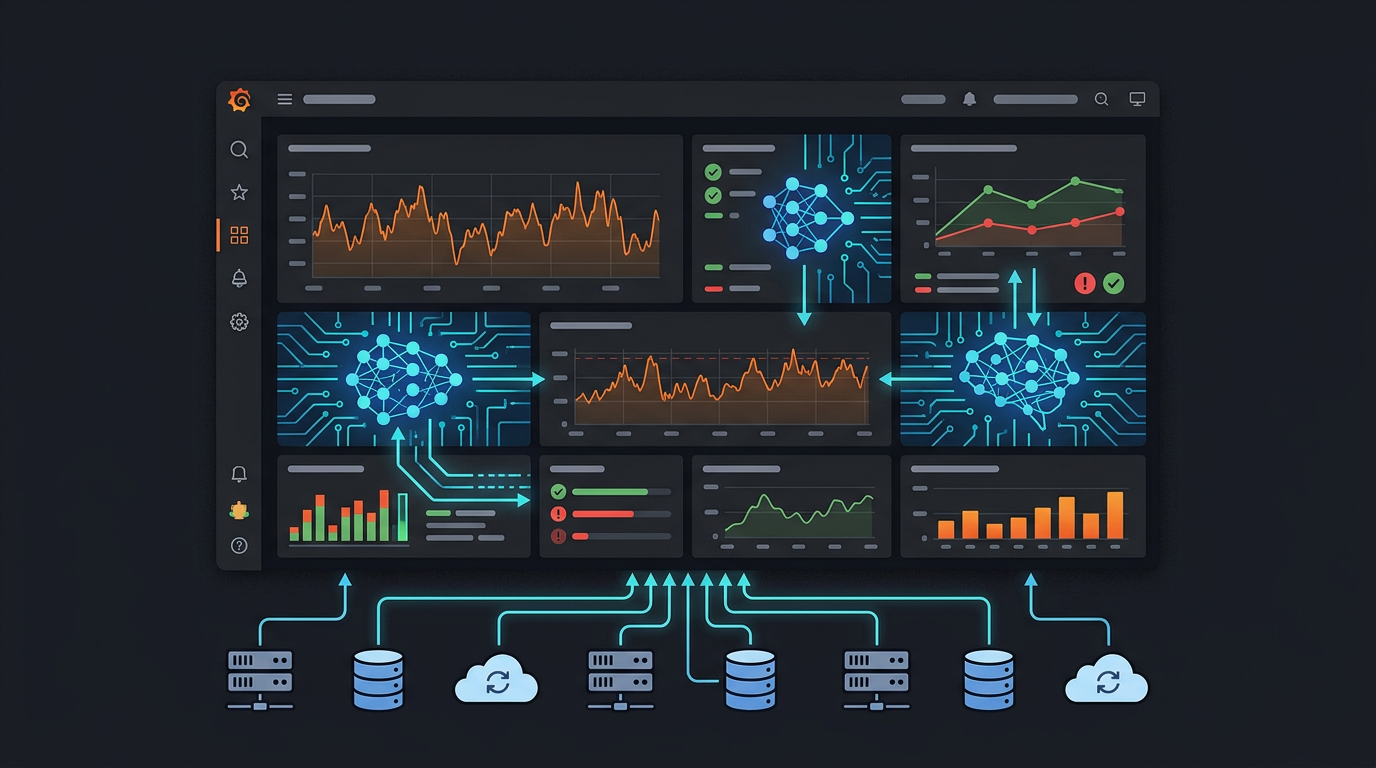
Grafana is where engineering teams go to understand what's happening in their infrastructure. Dashboards, alerts, logs, metrics — it's all there. But when something goes wrong at 3am, the workflow is still manual: open Grafana, find the right dashboard, scan the panels, correlate timestamps, dig into logs.

MCP changes that. With a Grafana MCP server, your AI agent can search dashboards, pull panel data, read alert states, create annotations, and explore datasources — answering "what happened?" conversationally instead of through dashboard clicking.

MCP Tool Observability: See Every Call Your AI Makes

· 3 min read
MCPBundles

Your AI assistant calls a tool through MCP. What actually happened? Did it work? How long did it take? What did it send, and what did it get back?

Before now, you'd dig through logs or just hope your AI would explain what happened. That's not enough.

We built complete tool execution tracking right into MCP Bundles. Every tool call gets logged with full context—timing, credentials used, results, everything. You can see exactly what your AI is doing, debug failures fast, and understand your tool usage patterns.

Tool History List