
MCP Tool Observability: See Every Call Your AI Makes
Your AI assistant calls a tool through MCP. What actually happened? Did it work? How long did it take? What did it send, and what did it get back?
Before now, you'd dig through logs or just hope your AI would explain what happened. That's not enough.
We built complete tool execution tracking right into MCP Bundles. Every tool call gets logged with full context—timing, credentials used, results, everything. You can see exactly what your AI is doing, debug failures fast, and understand your tool usage patterns.
Complete Execution Context
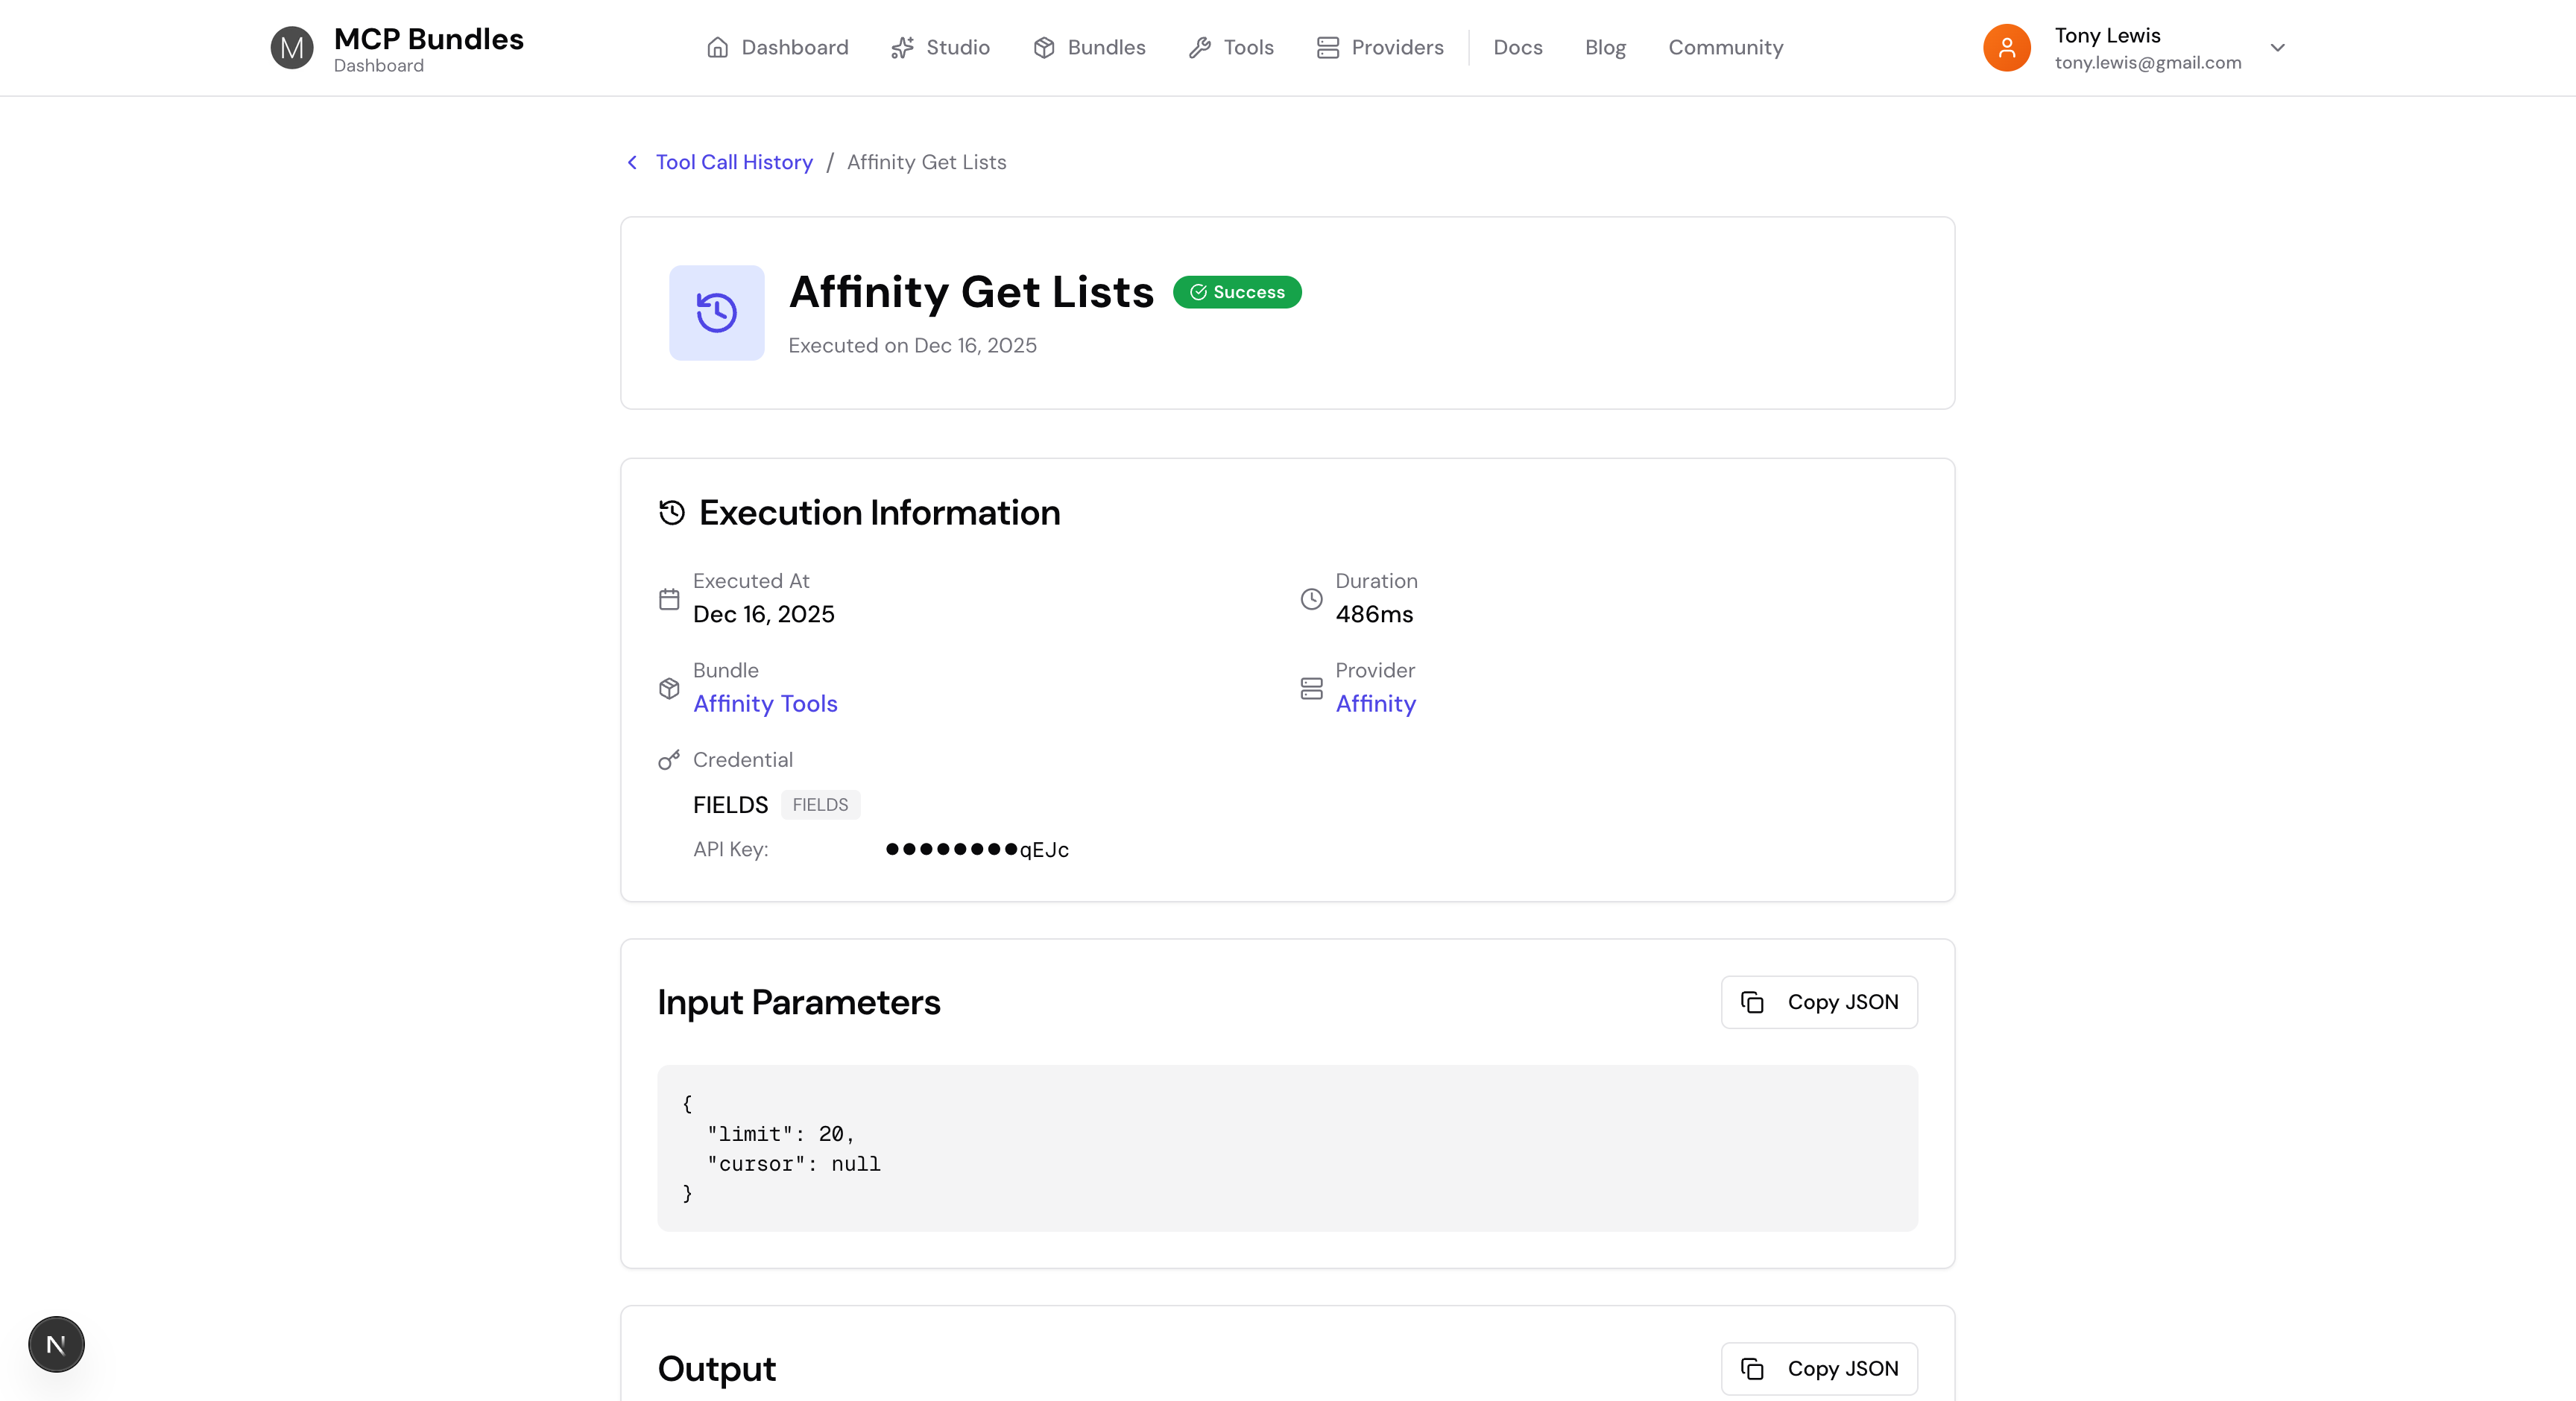
Each execution record has everything you need:
- What was called: Tool name, bundle, and provider
- When it happened: Exact timestamp with time
- How long it took: Duration in milliseconds
- What went in: Full input parameters
- What came out: Complete response data
- What credentials were used: Auth method and masked credential data
- Success or failure: Status with error messages when things break
This isn't just logging. It's a complete audit trail of every interaction your AI has with external services.
Debug Failures Instantly
When a tool call fails, you need to know why. Fast.
Click any execution to see the full details. Error messages are right there. Input parameters show exactly what was sent. You can see which credential was used and whether it's still valid.
No more guessing. No more "it worked yesterday" confusion. The execution history tells you exactly what happened and when.
Track Credential Usage
Every execution records which credential was used. You can see:
- Credential name or type (OAuth2, API Key, etc.)
- Masked credential data showing which fields were used
- Field labels from the credential schema
- Default values that were applied
This makes it easy to understand which credentials are being used for which tools, and troubleshoot authentication issues.
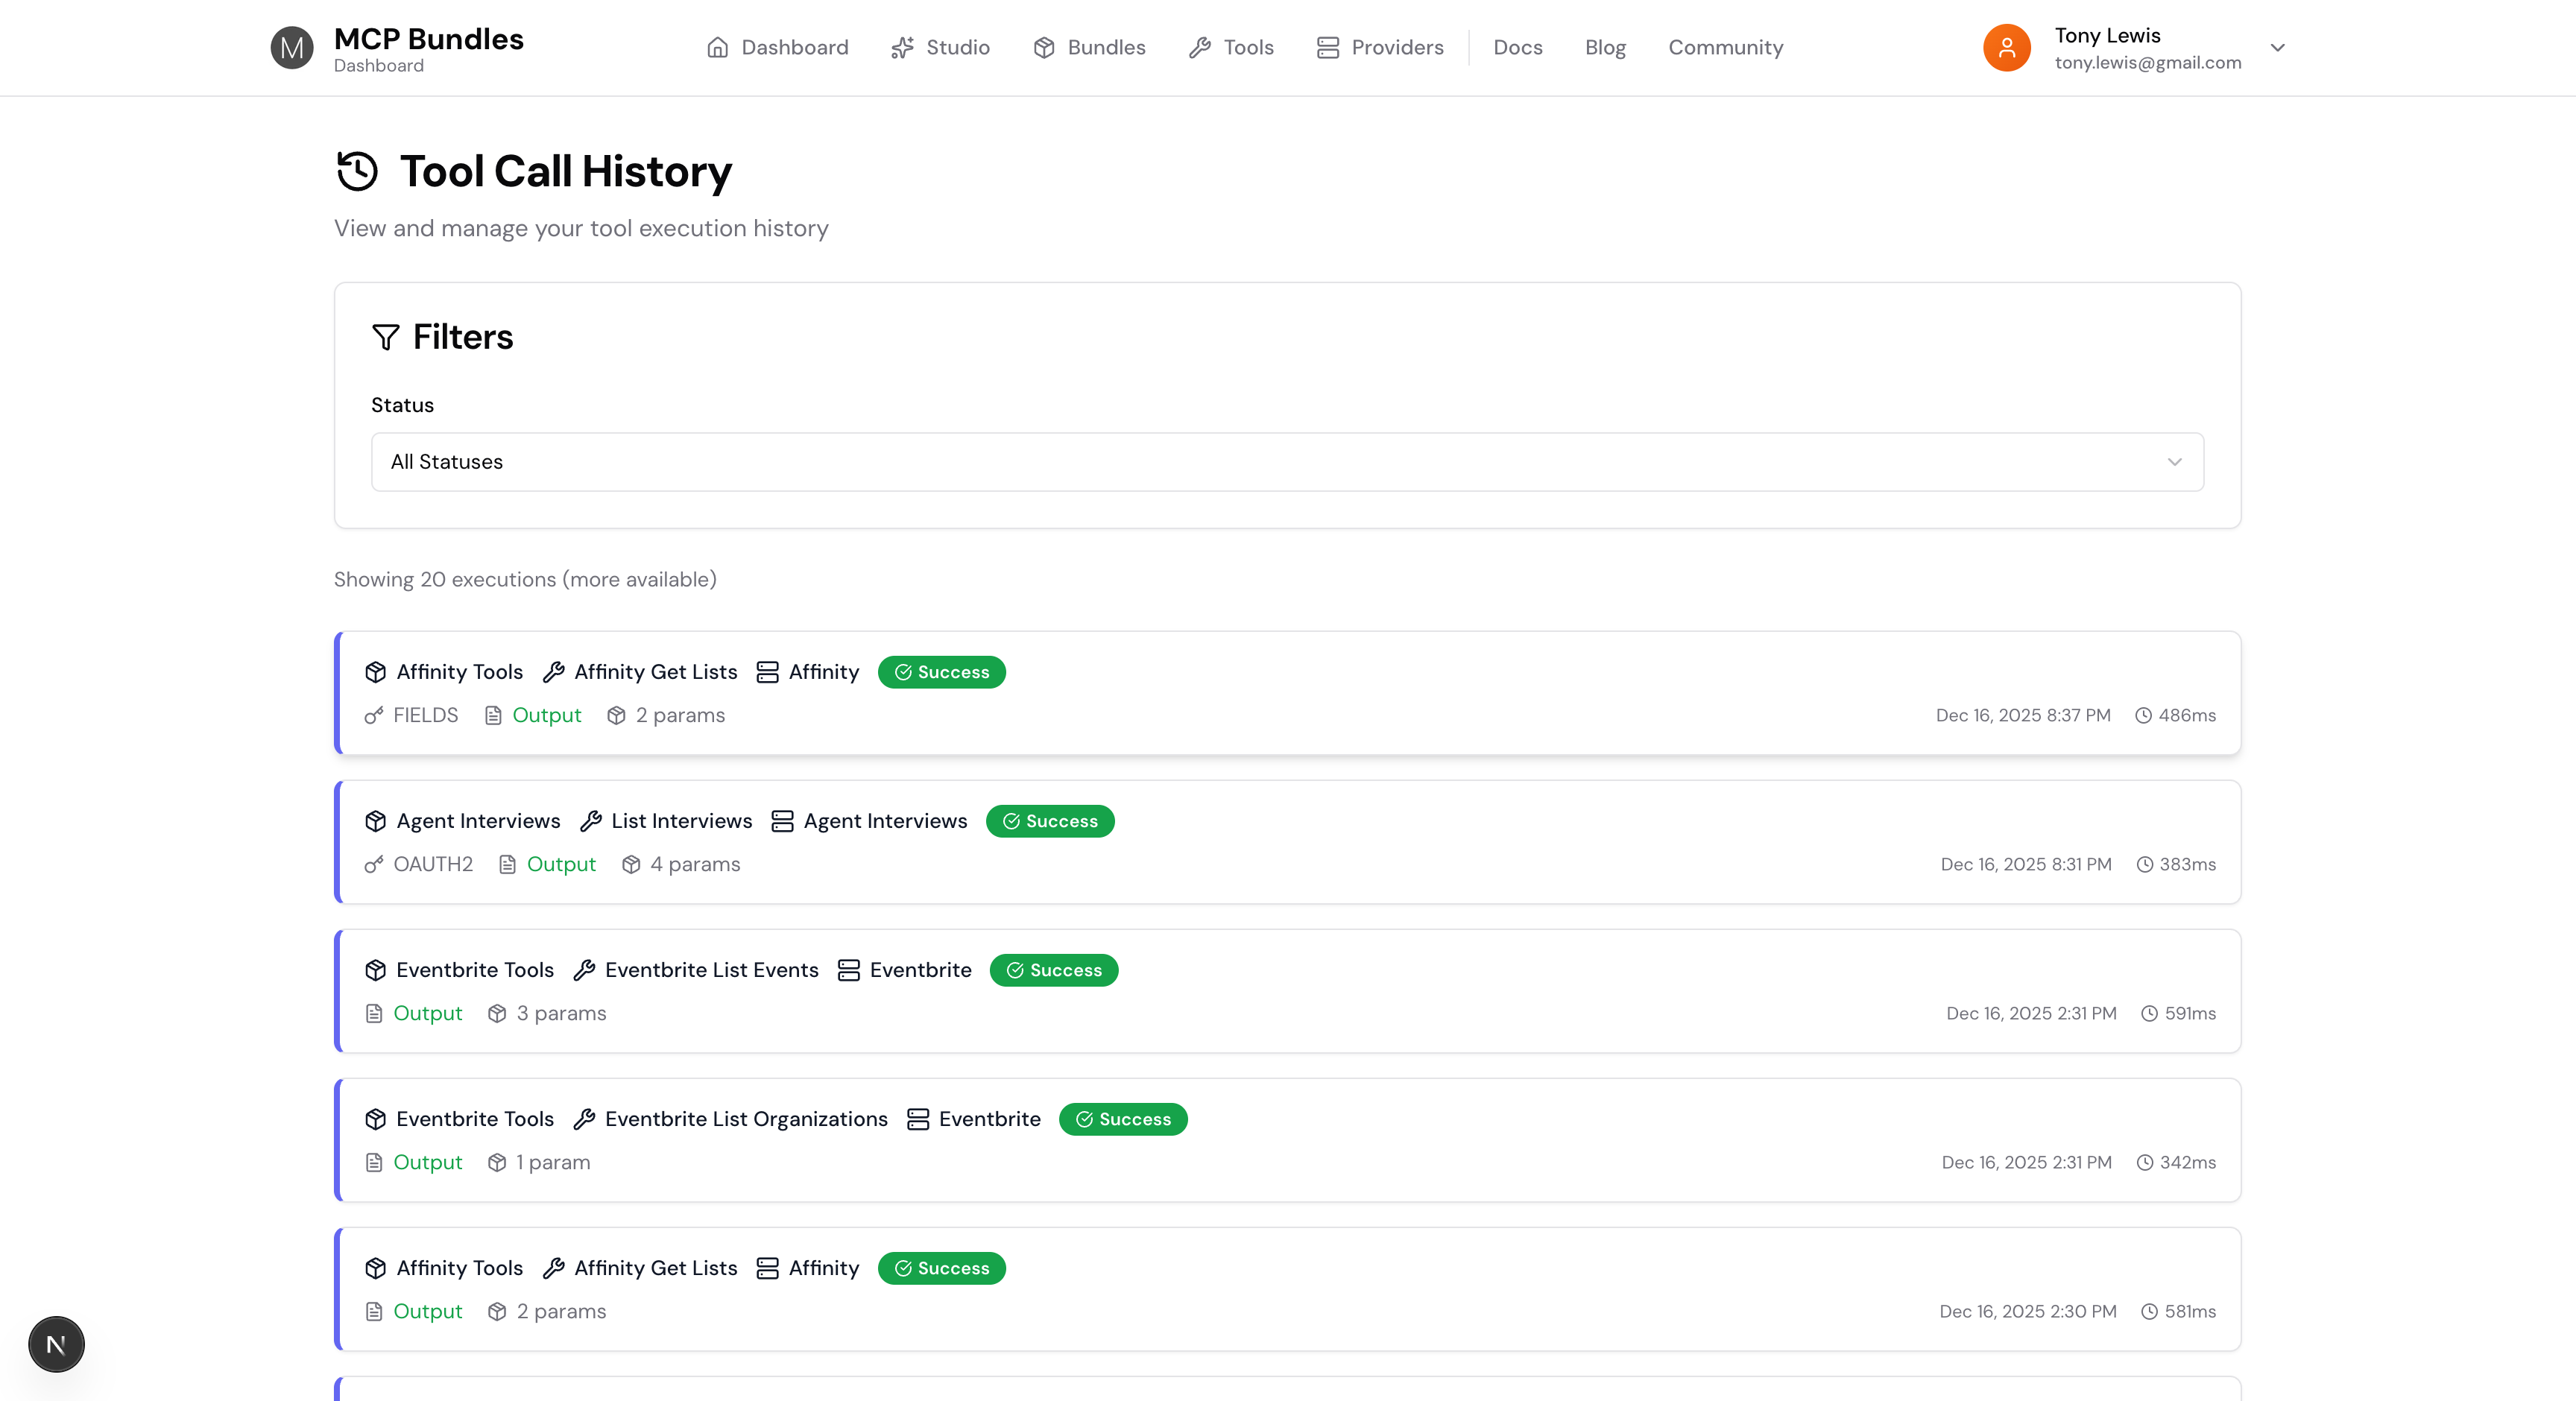
Filter and Search
The history page has filters to find exactly what you're looking for:
- Filter by status (Success, Failure, Timeout, Unauthorized)
- See execution counts and pagination
- Click through to bundle and provider detail pages
Everything is clickable. Bundle names link to bundle pages. Provider names link to provider pages. You can navigate the full context of any execution.
Performance Insights
Execution duration is tracked for every call. You can see which tools are fast and which ones take longer. This helps identify performance bottlenecks and optimize your tool usage.
The cards show duration right alongside the timestamp, so you can quickly spot slow executions.
Built for Production
This isn't a debugging-only feature. Tool execution history is always on, always tracking. It works for:
- Local MCP servers
- Remote MCP servers
- Bundled API integrations
- OAuth flows
- API key authentication
Every execution path is covered. You get the same level of observability whether your AI is calling a local database tool or making API requests to a third-party service.
What's Next
We're building more observability features:
- Execution analytics and trends
- Cost tracking for API-based tools
- Alerting on failures or slow executions
- Export capabilities for reporting
But the foundation is here now. You can see every tool call, debug every failure, and understand exactly what your AI assistants are doing.
Try it in your dashboard. Every tool execution is already being tracked.
Have questions or feedback? Join the conversation on Reddit.